


In today's hyper-competitive market, a well-oiled supply chain is no longer a 'nice-to-have' - it's the engine driving your profitability and customer loyalty. But how do you know if your engine is firing on all cylinders? The answer lies in data. By tracking the right supply chain performance metrics, you move from guesswork to strategic, data-driven decisions that cut costs, eliminate bottlenecks, and delight your customers.
This isn't just about numbers on a spreadsheet; it's about gaining a clear, actionable view of your entire operation, from procurement to the final mile. For businesses in specialized sectors like medical equipment manufacturing or construction distribution, precision is paramount. A logistics partner can leverage these key metrics to provide tailored, end-to-end solutions, ensuring that whether you're managing sensitive medical supplies or high-volume e-commerce orders, your supply chain is a source of competitive advantage, not a liability.
This guide breaks down the 7 most crucial supply chain performance metrics that every Canadian business leader needs to master. We will provide not just the definitions, but the formulas, industry benchmarks, and actionable insights required to transform your logistics from a simple cost centre into a powerful growth driver for your organization.
1. Order Fulfillment Cycle Time
In today's hyper-competitive market, speed is currency. Order Fulfillment Cycle Time is one of the most critical supply chain performance metrics because it directly measures your organization's responsiveness to customer demand. It calculates the total time elapsed from the moment a customer places an order to the moment they receive it. This end-to-end metric provides a comprehensive view of your operational efficiency, encompassing order processing, warehouse picking and packing, shipping, and final-mile delivery.
A shorter cycle time directly translates to higher customer satisfaction and loyalty. Companies like Amazon, with its Prime delivery, have fundamentally reshaped customer expectations, making rapid fulfilment a competitive necessity, not just a luxury. Similarly, Zara's agile supply chain, which moves designs from concept to store shelves in weeks, demonstrates how a compressed cycle time can become a powerful market differentiator.
How to Improve Your Cycle Time
Optimising this metric requires a holistic approach that scrutinises every stage of the fulfilment process.
- Automate Order Processing: Implement systems that automatically receive, verify, and route orders to the warehouse floor. This eliminates manual data entry, reduces human error, and cuts down on initial processing delays.
- Leverage Predictive Analytics: Use data to forecast demand and strategically position inventory closer to your customers. This pre-positioning shortens transit distances and delivery times, a key strategy for e-commerce vendors and distributors.
- Establish Clear Service Level Agreements (SLAs): Work with your logistics partners to define and enforce strict timelines for pickup, transit, and delivery. Hold them accountable for their performance.
- Integrate Real-Time Visibility: Use technology to create a single source of truth across all stakeholders, from your suppliers to your final-mile couriers. This allows for proactive problem-solving when delays occur. For deeper insights into optimizing your storage and retrieval processes, you can learn more about mastering warehousing and distribution.
2. Inventory Turnover Ratio
Cash tied up in inventory is cash that isn't working for your business. The Inventory Turnover Ratio is a fundamental supply chain performance metric that reveals how efficiently your company manages its stock. It calculates the number of times your entire inventory is sold and replenished over a specific period, typically a year. A higher ratio generally indicates strong sales and effective inventory management, while a low ratio can signal overstocking, obsolete products, or weak sales performance.

This metric is a cornerstone of operational excellence, popularised by figures like Sam Walton at Walmart and Taiichi Ohno through the Toyota Production System. For example, Walmart’s meticulous management results in about 8.7 inventory turns annually, while Costco’s limited SKU strategy pushes this figure to an impressive 11.8. These figures aren't just numbers; they represent a lean, responsive, and profitable supply chain that minimizes holding costs and maximizes capital efficiency.
How to Improve Your Inventory Turnover
Boosting your turnover ratio requires a strategic blend of forecasting, categorisation, and process refinement.
- Implement ABC Analysis: Prioritise your inventory by value. 'A' items are high-value, fast-moving products that require close monitoring. 'B' items are of moderate importance, and 'C' items are low-value, slow-movers. This allows you to focus your management efforts where they will have the most significant financial impact.
- Use Demand Forecasting: Leverage historical sales data and market trends to predict future demand more accurately. This prevents over-ordering during slow periods and stockouts during peak seasons, keeping inventory levels optimised.
- Benchmark Against Industry Averages: Your turnover ratio doesn't exist in a vacuum. Compare your performance to industry benchmarks to understand if you are leading or lagging. A ratio that is excellent in one industry, like heavy machinery, might be poor in another, like fast-moving consumer goods.
- Analyse Turnover by Product Category: A single, company-wide turnover number can be misleading. Drill down into specific product lines or categories to identify which items are performing well and which are draining resources, allowing for targeted action. To refine these strategies, you can explore this guide to achieve success with your warehouse inventory management.
3. Perfect Order Rate
While speed is important, accuracy is paramount. The Perfect Order Rate (POR) or Perfect Order Index (POI) is one of the most comprehensive supply chain performance metrics because it measures perfection from the customer's perspective. It calculates the percentage of orders delivered without any incidents, meaning they are complete, on time, damage-free, and with accurate documentation. This all-in-one metric provides a holistic view of your operational quality, moving beyond simple on-time delivery to capture the total customer experience.

A high POR is the ultimate indicator of a well-oiled supply chain, directly impacting customer satisfaction, reducing the cost of returns, and minimizing corrective actions. For instance, Procter & Gamble famously improved its POR from 60% to over 95% by reorganising its processes and fostering collaboration. Similarly, Unilever achieved a 98% perfect order rate by working closely with its suppliers and logistics partners, demonstrating that a commitment to quality at every step yields significant results and builds immense brand trust.
How to Improve Your Perfect Order Rate
Achieving a high POR requires meticulous attention to detail across every touchpoint of the order lifecycle.
- Define Clear Criteria: Establish and communicate unambiguous standards for each component of a "perfect order." What is your precise window for "on-time" delivery? What constitutes "damage-free" packaging? Ensure all partners, from suppliers to carriers, understand and agree to these definitions.
- Implement Quality Checkpoints: Integrate verification steps throughout the order process, not just at the final dispatch. Use barcode scanning for picking accuracy, conduct weight checks before shipping, and have a final quality assurance review before an order leaves the facility.
- Invest in Packaging and Handling: Poor packaging is a leading cause of damaged goods. Invest in high-quality materials and train staff on proper handling techniques to protect products throughout transit. This is especially critical for fragile items in the medical equipment or body care sectors.
- Collaborate with Partners: Your POR is only as strong as your weakest link. Work closely with your suppliers to ensure inbound materials are correct and on schedule, and partner with reliable logistics providers who share your commitment to quality and punctuality. Regular performance reviews are essential.
4. Supply Chain Cost as Percentage of Revenue
While speed is crucial, profitability is the ultimate goal. Supply Chain Cost as a Percentage of Revenue is a foundational supply chain performance metric that directly ties your operational spending to your company's top-line performance. It calculates the total cost of all supply chain activities (procurement, warehousing, transport, inventory, etc.) as a proportion of total revenue, offering a clear view of your supply chain's financial efficiency and its impact on your bottom line.
This metric helps you understand the relative cost burden of your supply chain and is a powerful tool for strategic decision-making. The following infographic highlights how this percentage varies dramatically even among industry giants, reflecting different business models and operational priorities.
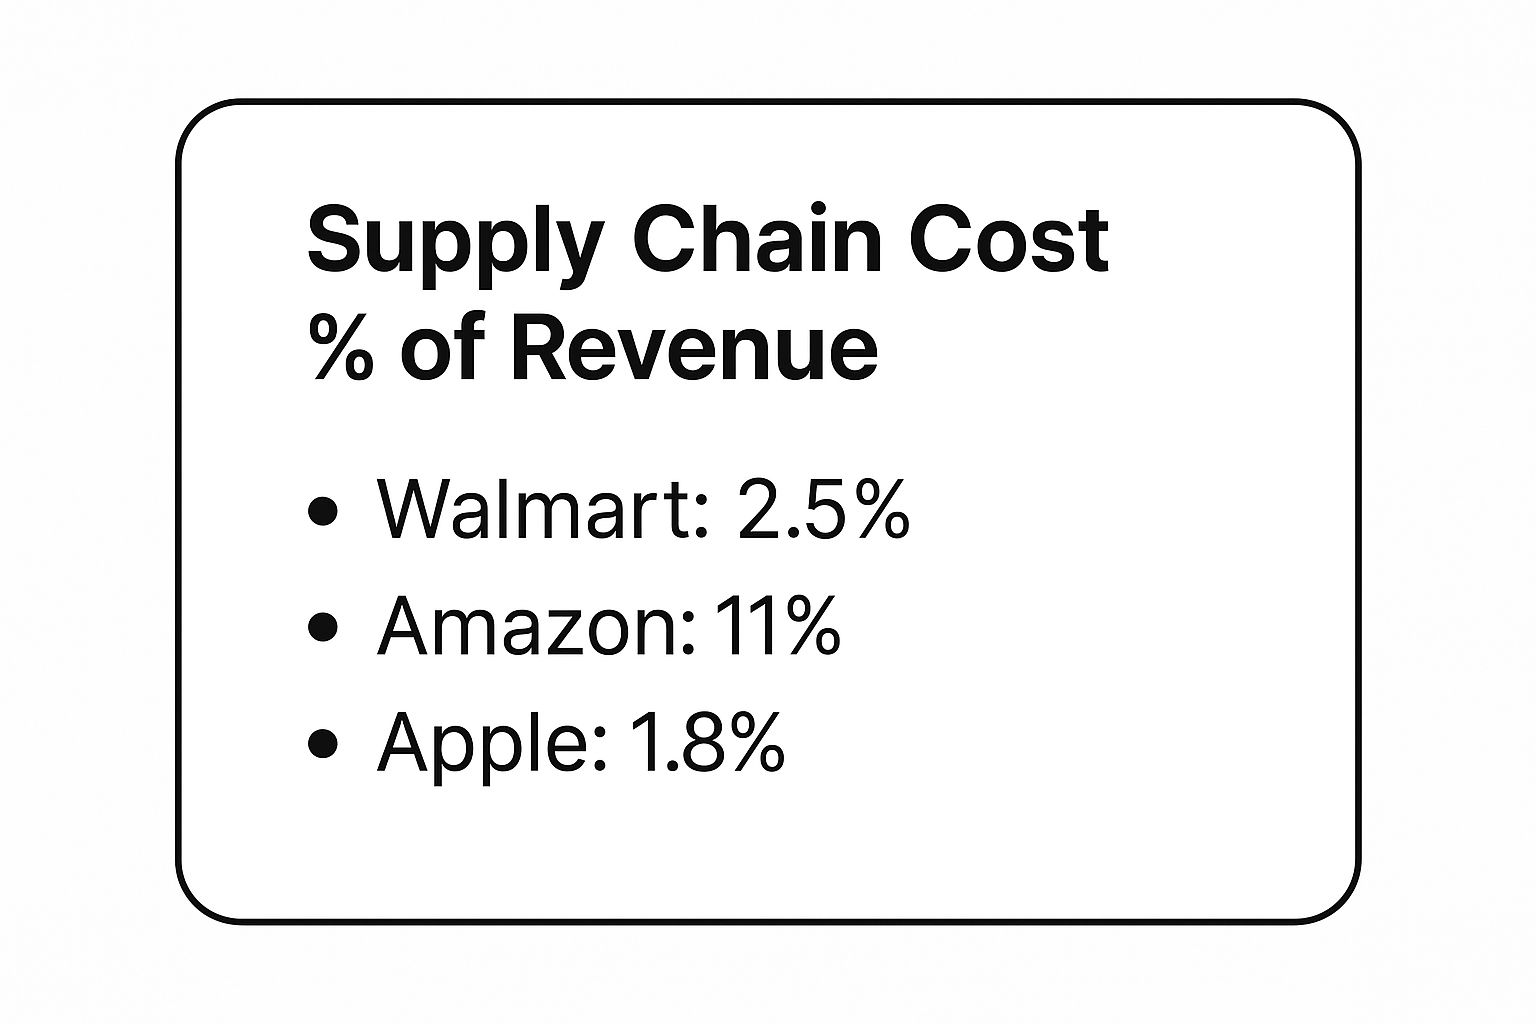
The data shows that lean, high-volume retailers like Walmart and hyper-optimised manufacturers like Apple achieve remarkably low percentages, while an e-commerce leader like Amazon invests more heavily in its supply chain to deliver unparalleled convenience and speed. For many manufacturing companies, this figure typically ranges higher, often between 15-25% of revenue, making cost control a constant focus.
How to Improve Your Cost-to-Revenue Ratio
Optimising this metric requires a granular understanding of every expense and its contribution to value.
- Implement Activity-Based Costing (ABC): Move beyond broad expense categories. ABC allows you to accurately allocate costs to specific activities, products, and customers, revealing where your money is truly being spent and identifying hidden inefficiencies.
- Analyse Total Cost of Ownership (TCO): When making procurement or logistics decisions, look beyond the initial price tag. TCO considers all associated costs over the lifecycle, such as maintenance, returns, and administrative overhead, leading to more financially sound choices.
- Benchmark Against Industry Peers: Regularly compare your cost percentage against similar companies in your sector. This provides essential context, helping you set realistic targets and understand if your costs are competitive or a liability.
- Focus on Cost Breakdowns and Trends: Don't fixate on a single number. Break down supply chain costs into major categories like transportation, warehousing, and inventory carrying costs. Tracking the trends of these individual components over time will provide more actionable insights than monitoring the total percentage alone.
5. Supplier Performance Score
Your supply chain is only as strong as its weakest link, and often, that link lies with your suppliers. A Supplier Performance Score is one of the most vital supply chain performance metrics because it moves beyond a single-threaded focus on cost. It's a composite metric that creates a holistic report card for each supplier, evaluating them across crucial dimensions like quality, on-time delivery, cost-effectiveness, and service levels. This scorecard approach gives you a data-backed, comprehensive view, enabling strategic supplier management and mitigating risks.
A robust supplier scoring system prevents disruptions and fosters collaborative, high-performing partnerships. For example, Toyota’s legendary production system relies heavily on a stringent supplier scorecard, which was credited with improving supplier quality by over 85%. Similarly, Walmart has expanded its scorecard to include sustainability metrics, driving environmental responsibility throughout its massive supply base. These examples show how a well-structured score can align your entire supply network with your core business objectives.
How to Improve Your Supplier Performance
Developing an effective scorecard and using it to drive improvement is a proactive, not a punitive, process.
- Weight Criteria Strategically: Not all criteria are equal. Weight the scorecard metrics based on what is most critical to your business. For a medical equipment manufacturer, quality and compliance might be weighted highest, while for a construction distributor, on-time delivery might be the top priority.
- Involve Suppliers in Development: Collaborate with your key suppliers when creating the scorecard. This fosters buy-in and ensures the metrics are realistic and well-understood, transforming the relationship from transactional to a true partnership.
- Provide Regular, Actionable Feedback: Don't just send a score once a quarter. Schedule regular review meetings to discuss performance, celebrate successes, and co-develop improvement plans for areas that are lagging. This turns the scorecard into a tool for continuous improvement, not just an evaluation.
- Align Scorecards with Business Goals: Ensure the metrics you track directly support your organisation's larger objectives. If your company is focused on a rapid new product introduction, your supplier scorecard should heavily favour innovation, speed, and flexibility.
6. Demand Forecast Accuracy
In the world of supply chain management, anticipating the future is not just an art; it’s a science. Demand Forecast Accuracy is one of the most foundational supply chain performance metrics, measuring how precisely your predictions align with actual customer demand. It is the cornerstone of efficient inventory management, strategic production planning, and effective resource allocation, preventing both costly overstocks and sales-killing stockouts.
A high forecast accuracy allows a business to operate with surgical precision. For example, Walmart leverages sophisticated machine learning algorithms to achieve impressive forecast accuracy, ensuring its shelves are stocked with what customers want, when they want it. Similarly, consumer goods giant Procter & Gamble (P&G) utilises a consensus forecasting process involving sales, marketing, and finance teams to consistently hit accuracy levels above 80%, optimising its entire production and distribution network. Getting this metric right is what separates proactive, market-leading organisations from reactive, inefficient ones.
How to Improve Your Forecast Accuracy
Boosting forecast accuracy requires a multi-faceted strategy that blends technology, collaboration, and continuous refinement.
- Implement Collaborative Forecasting: Break down internal silos. Engage sales, marketing, and even key customers and suppliers in the forecasting process. This approach, known as Collaborative Planning, Forecasting, and Replenishment (CPFR), provides a more holistic and accurate demand signal.
- Leverage Multiple Forecasting Models: Don't rely on a single algorithm. Test and compare different methods, such as moving averages, exponential smoothing, and machine learning models. Use the model that best fits the demand patterns of specific products.
- Incorporate External Data: Your sales history is only part of the story. Enrich your forecasts by integrating external factors like economic indicators, social media trends, competitor activities, and even weather patterns that can influence purchasing behaviour.
- Regularly Review and Refine: Forecasting is not a "set it and forget it" activity. Establish a regular cadence, typically within your Sales and Operations Planning (S&OP) cycle, to review forecast performance, identify sources of error, and adjust your models accordingly.
7. Cash-to-Cash Cycle Time
In the world of business, cash is king, and Cash-to-Cash (C2C) Cycle Time is the ultimate measure of your company's financial health and operational efficiency. This is one of the most vital supply chain performance metrics as it calculates the time elapsed between paying your suppliers for materials and receiving payment from your customers for the final product. It essentially measures how long your company's cash is tied up in working capital.
A lower, or even negative, C2C cycle time indicates a highly efficient and financially robust supply chain. It means your company gets paid by its customers before it even has to pay its own suppliers, freeing up cash for reinvestment, innovation, or navigating economic uncertainty. The classic example is Dell, which pioneered a direct-to-consumer model that resulted in a negative C2C cycle, a powerful competitive advantage that helped fuel its growth.
How to Improve Your C2C Cycle Time
Improving your C2C cycle requires a coordinated effort across procurement, operations, and finance to optimise three core components: inventory, accounts payable, and accounts receivable.
- Accelerate Accounts Receivable: Implement strict and efficient collection processes to ensure customers pay on time. Offer incentives for early payment and automate invoicing and reminders to reduce delays in receiving cash.
- Extend Accounts Payable: Negotiate more favourable payment terms with your suppliers. A longer payment window gives you more time to convert inventory into sales before your own bills are due, directly shortening the C2C cycle.
- Optimise Inventory Levels: A lean inventory is a core driver of a short C2C cycle. Minimise the amount of cash tied up in raw materials, work-in-progress, and finished goods by improving demand forecasting and increasing inventory turnover. Strategies like just-in-time (JIT) and cross-docking can significantly reduce the time inventory sits idle. You can discover more about how to implement these strategies in our guide to efficient cross-docking services.
- Monitor Trends Holistically: Don't focus on just one component in isolation. A drastic change in one area can negatively impact another. Track the C2C cycle time trend over time to ensure your improvements are balanced and sustainable across the entire supply chain.
Supply Chain Metrics Comparison
| Metric | Implementation Complexity 🔄 | Resource Requirements ⚡ | Expected Outcomes 📊 | Ideal Use Cases 💡 | Key Advantages ⭐ |
|---|---|---|---|---|---|
| Order Fulfillment Cycle Time | Medium-High: Requires sophisticated tracking | High: Real-time systems and IT | Faster delivery, improved customer satisfaction | E-commerce, retail, businesses focusing on speed | Direct link to customer satisfaction; bottleneck ID |
| Inventory Turnover Ratio | Medium: Standardized calculation, seasonal adj. | Medium: Financial and inventory data | Efficient inventory use, reduced carrying costs | Inventory management, procurement, retail, manufacturing | Improves cash flow and working capital usage |
| Perfect Order Rate | High: Multi-dimensional and quality tracking | High: Tracking multiple quality factors | Higher order accuracy and customer satisfaction | Quality-focused supply chains, high-value customer orders | Comprehensive supply chain performance view |
| Supply Chain Cost % of Revenue | Medium-High: Requires detailed cost accounting | Medium-High: Financial systems and analysis | Cost reduction, ROI visibility | All industries targeting cost efficiency | Links supply chain costs directly to profitability |
| Supplier Performance Score | High: Multi-factor weighted scoring system | High: Data collection & supplier collaboration | Improved supplier reliability and risk management | Supplier management, risk assessment, procurement | Objective evaluation, supplier development |
| Demand Forecast Accuracy | Medium: Multiple forecasting methods required | Medium: Forecasting tools and data | Optimized inventory, reduced stockouts | Inventory planning, production scheduling | Supports better planning and reduces waste |
| Cash-to-Cash Cycle Time | High: Complex financial tracking and integration | High: Financial systems and processes | Improved cash flow and working capital efficiency | Financial management, supply chain finance | Enhances liquidity and reduces financing costs |
Turn Your Metrics into Momentum with a Strategic Partner
We've explored a powerful toolkit of seven critical supply chain performance metrics, moving from theory to practical application. From the speed of your Order Fulfillment Cycle Time to the financial efficiency revealed by your Cash-to-Cash Cycle Time, each metric serves as a vital diagnostic tool. Understanding these numbers is the foundational first step, but true competitive advantage is not found in the data itself. It's unlocked by the strategic actions you take in response.
The journey from measurement to mastery requires translating raw data into tangible operational improvements. It's about recognising that a low Inventory Turnover Ratio isn't just a number; it's a signal of tied-up capital and potential obsolescence. Similarly, a declining Perfect Order Rate is a direct reflection of customer dissatisfaction and rising operational costs. The core takeaway is this: your supply chain is not merely a cost centre, but a dynamic, strategic asset capable of driving growth, enhancing customer loyalty, and protecting your bottom line.
From Insight to Impact: Your Actionable Next Steps
To truly leverage the power of these metrics, you must move beyond passive monitoring and embrace a culture of continuous, data-driven improvement. This transition involves a clear, focused strategy:
- Establish Baselines: You cannot improve what you do not measure. Your immediate priority should be to establish clear, accurate baselines for each of the seven metrics discussed. This is your starting point, your "you are here" map.
- Set Realistic Targets: Armed with your baselines, set specific, measurable, achievable, relevant, and time-bound (SMART) goals for improvement. Aim to reduce your fulfillment cycle time by 10% in the next quarter or increase your forecast accuracy by 5% over six months.
- Empower Your Team: Share these insights and goals across your organisation. When your warehouse team understands the direct impact of their accuracy on the Perfect Order Rate, they become active participants in the solution.
- Leverage Technology and Partnerships: Manual tracking is prone to error and inefficiency. Implementing the right technology or, more crucially, partnering with an expert who already has the systems and infrastructure in place, can accelerate your progress exponentially.
"A metric is a map, not the destination. Its true value is in guiding your next move. Without action, you're just admiring the cartography while your competitors are already on the road."
Ultimately, mastering your supply chain performance metrics is about transforming your operations from reactive to proactive. It’s about building a resilient, agile, and customer-centric supply chain that not only withstands disruption but thrives on efficiency. This is where a dedicated logistics partner becomes more than a vendor; they become an extension of your team, providing the expertise and infrastructure to turn your performance goals into reality. By focusing on these key indicators, you pave the way for a more profitable and sustainable future, turning your supply chain into your most significant competitive advantage.
Ready to transform your supply chain data into decisive action and measurable results? The experts at Waff Logistics Inc specialise in analysing your core metrics to design and implement smarter, more efficient logistics solutions across Canada and the USA. Let's build a supply chain that drives your business forward.


